
A good YouTube CTR typically falls between 4% and 6% for most channels, but the answer depends entirely on traffic source. A 5% CTR can be excellent on Browse yet weak on Search.
That immediately makes the most popular advice about click-through rate incomplete. Creators often get handed a broad benchmark, compare it with the number in YouTube Studio, and decide their thumbnails are either failing or outperforming. The problem is that one blended percentage can hide three very different viewer situations.
Someone searching for a precise answer already has intent. Someone watching a related video has topical context. Someone scrolling through the Home feed is weighing your thumbnail against a crowded set of alternatives. Those viewers don’t give you the same chance of earning a click, so their CTR shouldn’t be judged by the same yardstick.
Table of Contents
- Why a Single CTR Benchmark Misleads Creators
- How to Calculate Your YouTube Click-Through Rate
- YouTube CTR Benchmarks by Traffic Source
- How YouTube CTR Compares to Other Platforms
- Proven Strategies to Improve Your YouTube CTR
- When Higher CTR Actually Hurts Your Channel
- Measuring CTR Improvements with Statistical Significance
Why a Single CTR Benchmark Misleads Creators
A headline such as “a good YouTube CTR is 2% to 10%” sounds useful because it offers a clear range. In practice, it’s too broad to guide a thumbnail decision. A result near the bottom may signal a weak title-thumbnail match, or it may reflect broad Browse distribution. A result near the top may show strong packaging, or it may come from a narrow, high-intent Search audience.
Independent benchmark reporting places typical CTR for established channels between 3% and 8% across most niches, with outliers above 10% on highly optimized channels, drawn from videos with at least 10,000 impressions so the percentages rest on a stable sample. The benchmark study on thumbnail CTR patterns also finds that the same packaging choice pays off differently by niche, by traffic source, and by whether the viewer already knows the channel, which is why its ranges are better read as distributions than as a pass-or-fail score.
The same percentage can mean different things
Consider two videos with a 5% impressions CTR:
- On Browse, that may indicate that the packaging is holding its own against a wide range of competing recommendations.
- On Search, it may indicate that the title doesn’t align closely enough with the query, or that the thumbnail fails to distinguish the video from directly competing results.
- On Suggested, the interpretation depends on how closely the neighboring videos match the viewer’s current interest.
That isn’t a contradiction. The impression came from a different decision environment.
Audience familiarity changes the equation as well. Returning viewers may recognize your visual style and click with less explanation. New viewers need a clearer promise before they commit. Niche expectations matter too. A technical tutorial, a reaction video, and a product review don’t compete for attention in exactly the same way.
Practical rule: Don’t ask whether your CTR is good in isolation. Ask whether it is good for the surface that generated the impression.
YouTube analytics becomes more actionable when you connect packaging to distribution. A thumbnail that works in Search may not work on Home, and a title written for a query may feel flat in Suggested. Understanding how the YouTube algorithm works helps explain why the same video can produce different results across surfaces.
The useful benchmark is therefore your own channel context. Compare Browse with Browse, Search with Search, and Suggested with Suggested. A channel-level average is a starting signal, not a diagnosis.
How to Calculate Your YouTube Click-Through Rate
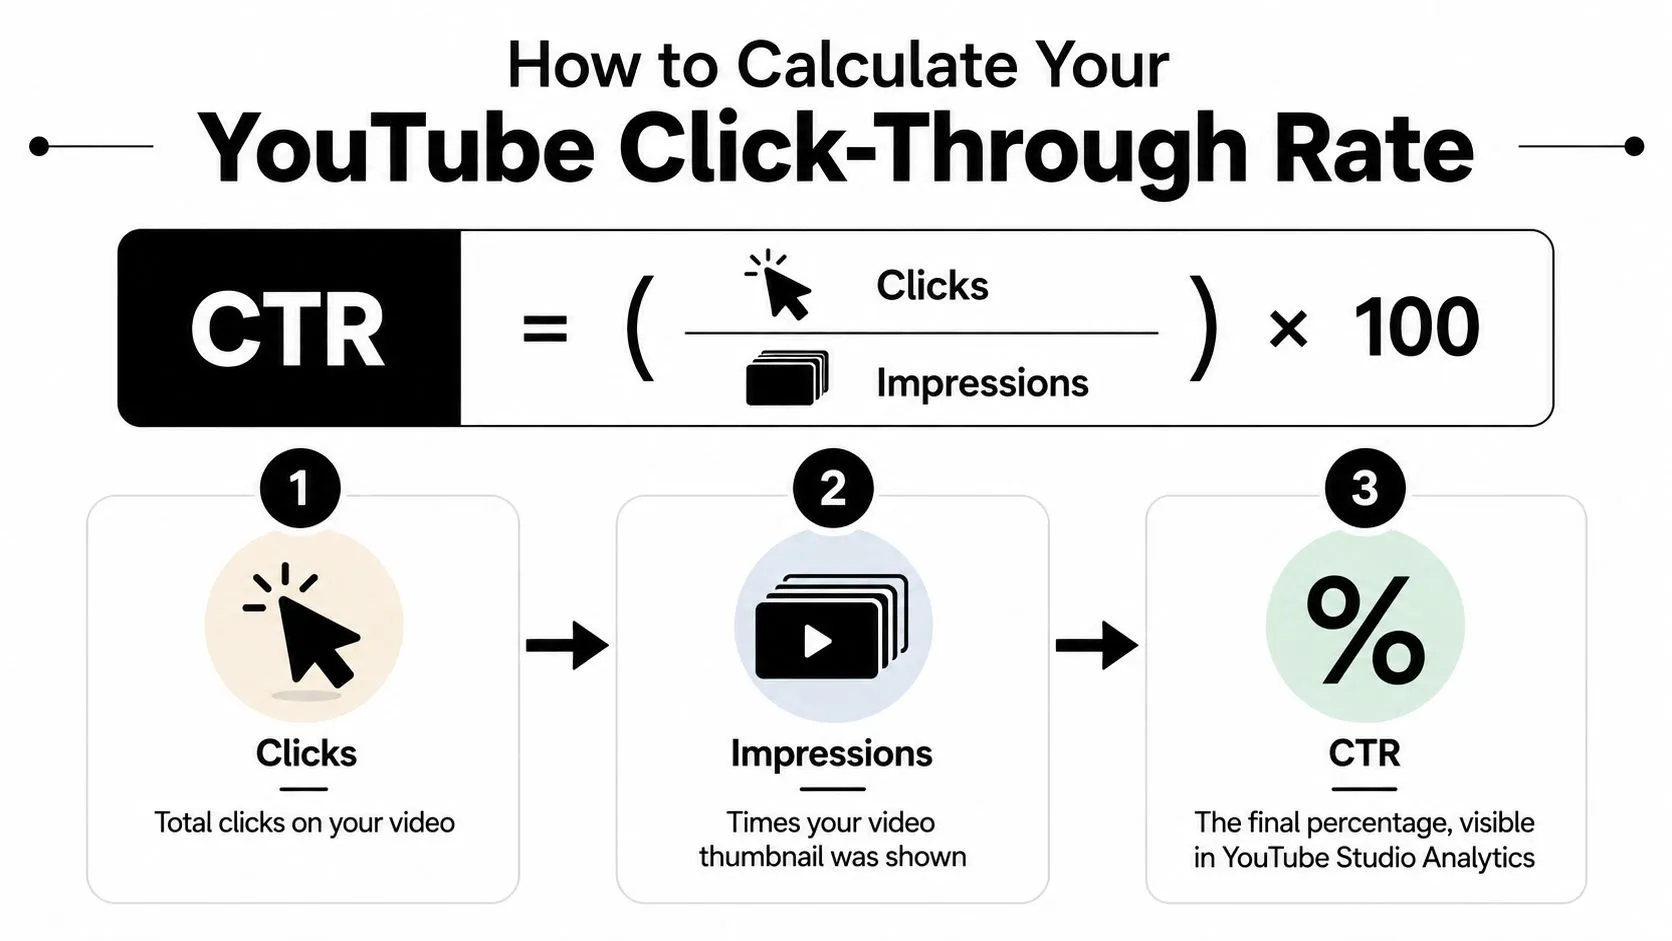
YouTube impressions CTR uses a straightforward formula:
CTR = (Clicks ÷ Impressions) × 100
For example, if a thumbnail receives clicks from a portion of the impressions it generated, the resulting percentage tells you how often viewers chose the video after seeing that thumbnail. The formula is simple. The difficult part is choosing the right comparison set.
Pull the right figures from YouTube Studio
Open YouTube Studio and select Analytics for the video or channel you want to evaluate. In the Reach area, review impressions and impressions click-through rate. Then use the traffic-source breakdown to see whether those impressions came from Browse features, YouTube Search, Suggested videos, or another surface.
Use the aggregate figure for orientation, but don’t stop there. A blended CTR can move because YouTube changed the mix of surfaces delivering your impressions. If Search impressions rise while Browse impressions fall, the overall number may change even when the thumbnail performs exactly as it did before on each individual surface.
Keep impressions CTR separate from other click metrics
Impressions CTR measures clicks associated with eligible thumbnail impressions. It isn’t the same as a unique viewer rate, and it shouldn’t be treated as a universal measure of audience interest. Some views don’t result from an eligible impression, so total views and impressions CTR won’t always map neatly.
Record the following for each video:
- Traffic source: Browse, Search, Suggested, or another surface.
- Impressions: The number of eligible thumbnail exposures.
- Impressions CTR: The percentage generated from those impressions.
- Watch-time context: Retention and viewing behavior after the click.
- Packaging change: The title, thumbnail, or both.
Daily readings can be noisy, especially while a video is moving between audiences. Use a 90-day median for each major traffic source as a practical baseline, then flag videos that sit meaningfully below that baseline. Exporting or manually logging this information in a spreadsheet lets you compare packaging changes over time instead of relying on memory.
The calculation tells you what happened. The source-specific baseline tells you whether it matters.
YouTube CTR Benchmarks by Traffic Source
Traffic source is the most useful first filter for interpreting YouTube CTR. A benchmark summary places average CTR around 12.5% for Search, 9.5% for Suggested, and 3.5% for Browse. These figures come from traffic-source-specific thumbnail CTR data, and their value is less about declaring winners than about showing why a single channel average can mislead.
| Traffic Source | Average CTR | Strong Performance | Weak Performance |
|---|---|---|---|
| Search | 12.5% | Above the relevant Search baseline | Below the channel’s Search baseline |
| Suggested | 9.5% | Above the relevant Suggested baseline | Below the channel’s Suggested baseline |
| Browse | 3.5% | Above the relevant Browse baseline | Below the channel’s Browse baseline |
Browse features
Browse viewers usually encounter your video while exploring Home, subscriptions, or other browsing surfaces. They may not have a defined question, which means your thumbnail and title must create relevance quickly. The viewer is comparing your package with many alternatives, so a modest-looking CTR isn’t automatically a failure.
A 5% Browse CTR can be a strong result when the channel is reaching a broad audience. The important comparison is your own Browse history, not the Search figure in the same report.
Packaging for Browse should communicate a clear outcome, recognizable subject, and immediate visual hierarchy. Overloaded thumbnails often lose because the viewer can’t identify the subject or promise at a glance.
Search traffic
Search viewers have already expressed an interest through a query. Their click depends more heavily on whether your title and thumbnail match that intent and offer a credible answer. That makes Search CTR naturally higher in the benchmark data.
A Search result that earns 5% may need attention even if the same number would look healthy on Browse. Check whether the main query appears clearly in the title, whether the promise matches the actual video, and whether competing results explain the benefit more effectively.
Suggested videos
Suggested viewers have context from the video they were already watching. Topical adjacency, subject continuity, and session placement influence the click alongside the thumbnail and title. A strong Suggested result often comes from a package that feels like the natural next video, not merely a generally attractive design.
Use the benchmark as a directional reference, then establish a separate baseline for your channel. If your videos receive traffic from several surfaces, the correct question isn’t “What is my CTR?” It’s “Where does my packaging lose the viewer?”
That distinction also matters when you evaluate formats separately. Shorts, for example, use different viewing behavior and shouldn’t be judged through the same impressions CTR framework as long-form videos. Creators researching YouTube Shorts monetization should keep those format differences in mind.
How YouTube CTR Compares to Other Platforms
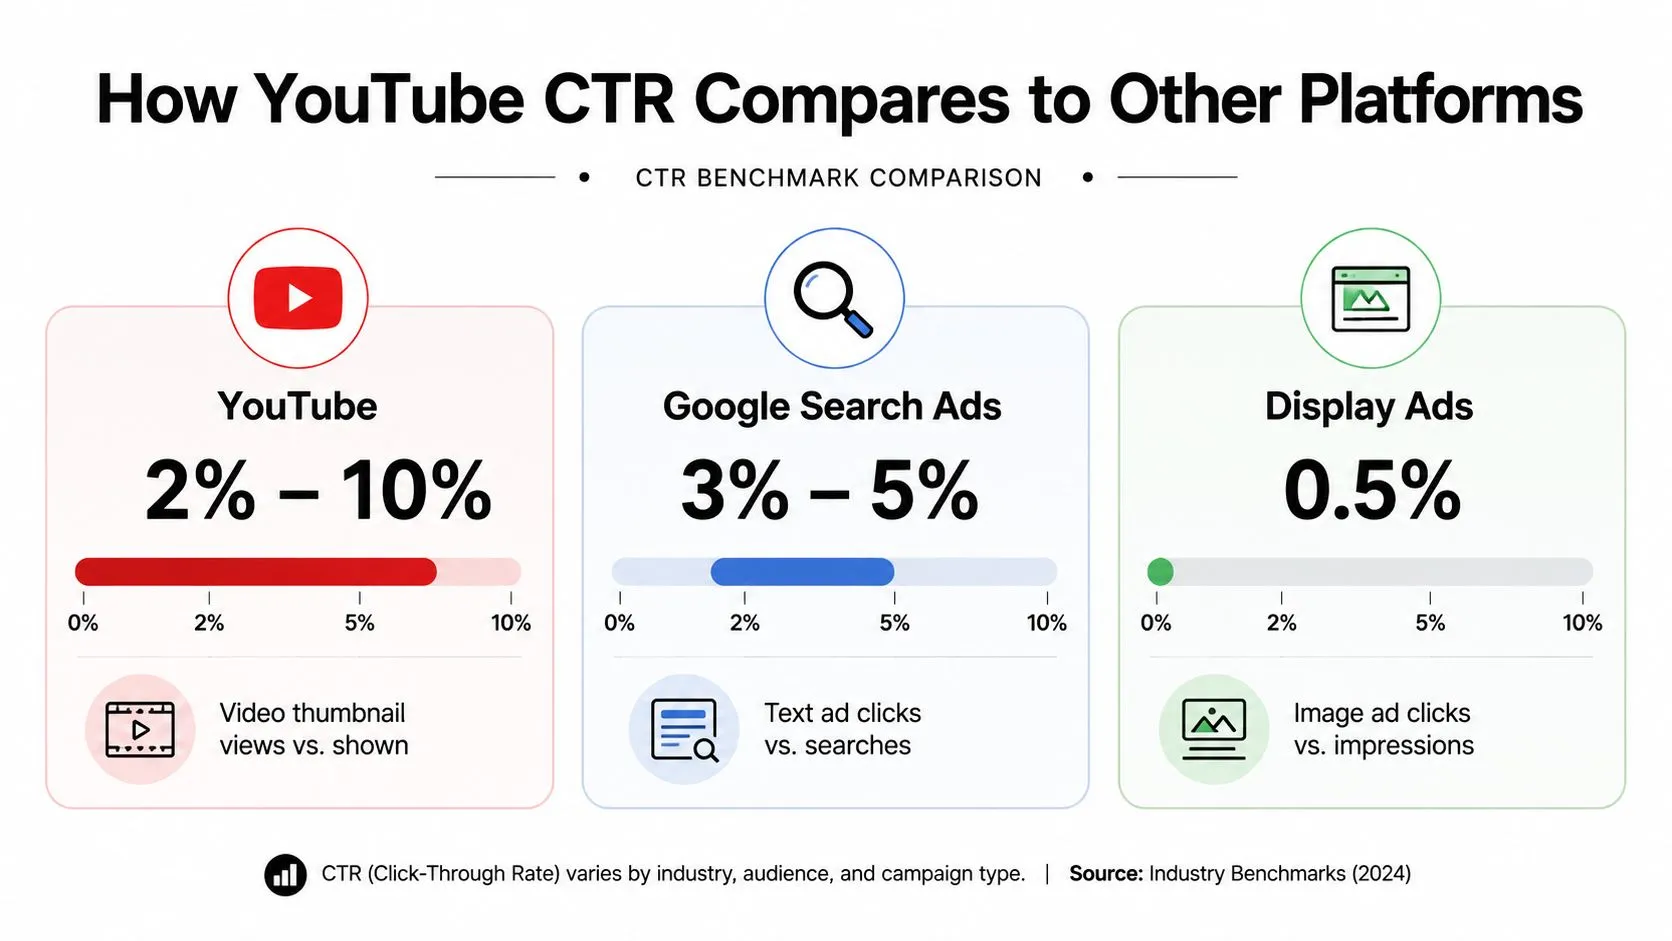
Creators often compare an organic YouTube CTR with figures from search or display advertising. That comparison can create unnecessary alarm because the platforms measure clicks in different environments.
For YouTube specifically, the commonly cited impressions CTR distribution spans 2% to 10%, with many channels clustering around 4% to 6%. One breakdown of average YouTube CTR by niche and video length treats that 4% to 6% band as the platform average, counts 8% to 10% as strong for an established channel, and puts channels under 1,000 subscribers nearer 2% to 4% while the algorithm is still learning who to show them to. Paid formats are measured in a different environment, so the two shouldn’t be combined into one performance scale.
Intent changes the click opportunity
Google Search Ads appear when users actively search for something. That intent makes a click more plausible because the user is already trying to solve a problem or find a product. Display advertising interrupts browsing behavior, so its CTR is generally much lower.
YouTube organic recommendations sit between those experiences. Search viewers have intent, but Browse viewers may be discovering a topic without asking for it. The thumbnail carries much of the initial burden because it must earn attention before the viewer has committed to a specific question.
Paid YouTube video ads operate under another set of conditions. Skippable YouTube ads commonly sit around 0.3% to 0.5% CTR, while performance above 1% is considered strong in the cited benchmark. The same platform comparison for paid digital advertising puts Google Search Ads at 3% to 5%, which shows why a 0.5% result can be healthy for a YouTube ad but weak for a high-intent search campaign.
Use cross-platform data for context, not judgment
A creator shouldn’t decide that a YouTube organic result is poor because it falls below a Search Ads benchmark. The denominator, placement, audience intent, and creative format differ.
Use outside benchmarks to understand the mechanics of each channel. Use your own historical data to make decisions. If a Browse thumbnail beats your channel’s Browse median and produces healthy viewing behavior, it may be doing its job even if its number looks modest beside a Search figure.
Proven Strategies to Improve Your YouTube CTR
CTR responds most directly to the two pieces of packaging viewers see before they click, the thumbnail and title. Improving both doesn’t mean making the video louder or more sensational. It means making the promise easier to understand and more relevant to the audience receiving the impression.

Build the thumbnail around one decision
A viewer should understand the central subject without decoding several competing elements. Start with one focal object, face, or visual contrast. Remove decorative details that disappear at small sizes, especially when the thumbnail appears beside many other recommendations.
Use text only when it adds information the title doesn’t already provide. Short, high-contrast wording is usually easier to scan than a sentence copied from the title. The thumbnail and title should work together, with each contributing a different part of the promise.
Thumbo AI can generate thumbnail concepts from a video idea or a few photos, which gives creators a practical way to explore alternative visual directions before settling on a final package. It should support the testing process, not replace judgment about audience fit.
Write titles for the surface
A Search title should make the topic and intent obvious. A Browse title can create curiosity, but it still needs to communicate a credible reason to watch. Suggested titles benefit from continuity with the video that precedes them, particularly when the audience expects a related next step.
Avoid manufacturing a promise the video can’t fulfill. A title that attracts the wrong viewer may lift the initial click signal while creating disappointment immediately afterward. The strongest packaging creates enough curiosity to earn the click and enough accuracy to sustain attention.
Creators looking for a practical workflow can use this guide to creating a YouTube thumbnail while developing several distinct concepts rather than polishing one idea indefinitely.
Test one meaningful change
Change either the thumbnail concept or the title angle first. If both change at once, you may improve the result without learning which decision caused the movement.
A useful test log includes:
- Original package: Save the thumbnail and title before changing them.
- Hypothesis: Write what you expect the new version to improve, such as clarity, contrast, or Search alignment.
- Surface: Record whether the test is evaluated on Browse, Search, or Suggested.
- Outcome: Compare CTR with retention and watch-time behavior.
- Decision: Keep the change, revert it, or develop a third version.
YouTube’s native thumbnail testing tools and reputable third-party testing platforms can help organize variants. Don’t call a winner from a short-lived spike. Let the package gather enough impressions and clicks to represent the audience you want, then compare it with the appropriate historical baseline.
When Higher CTR Actually Hurts Your Channel
A click is a beginning, not a completed outcome. If the thumbnail and title attract viewers who quickly discover that the video isn’t what they expected, the high CTR may conceal a packaging problem.
Misleading packaging creates a mismatch between expectation and delivery. A dramatic title may pull a viewer into a tutorial that takes too long to reach the promised point. A thumbnail may suggest a result the video only discusses briefly. The creator receives the click, but the viewer receives a reason to leave.
Pair CTR with what happens after the click
YouTube strategy works better when CTR sits beside retention and watch-time context. Benchmark guidance increasingly emphasizes that high CTR isn’t automatically valuable if the video fails to satisfy the people it attracts. The central trade-off is straightforward: strong performance comes from thumbnail-title alignment and testing, not from visual exaggeration alone. A thumbnail promise that the video doesn’t keep tends to get deprioritized rather than rewarded, because watch time is what the recommendation system reads next.
Review the opening carefully:
- Does the first part of the video deliver the promise made by the package?
- Does the introduction confirm that the viewer chose the right video?
- Does the structure maintain the expectation created by the thumbnail?
- Do viewers who arrive from Browse behave differently from those arriving through Search?
A lower CTR can be preferable when it filters for viewers who need the content. Those viewers may watch longer, continue to another video, and develop confidence in the channel’s promises.
The right click is more valuable than the maximum number of clicks.
Choose the metric that matches the problem
If impressions are strong but CTR is below your source-specific baseline, test the package. If CTR is healthy but early retention is weak, inspect the opening and the promise. If both are healthy but distribution remains limited, investigate topic demand, audience fit, and the relationship between the video and its neighboring recommendations.
Don’t use a thumbnail refresh to solve a retention problem. Don’t rewrite a title to compensate for a video that delays its main value. Good optimization follows the failure point instead of treating every performance issue as a click problem.
Measuring CTR Improvements with Statistical Significance
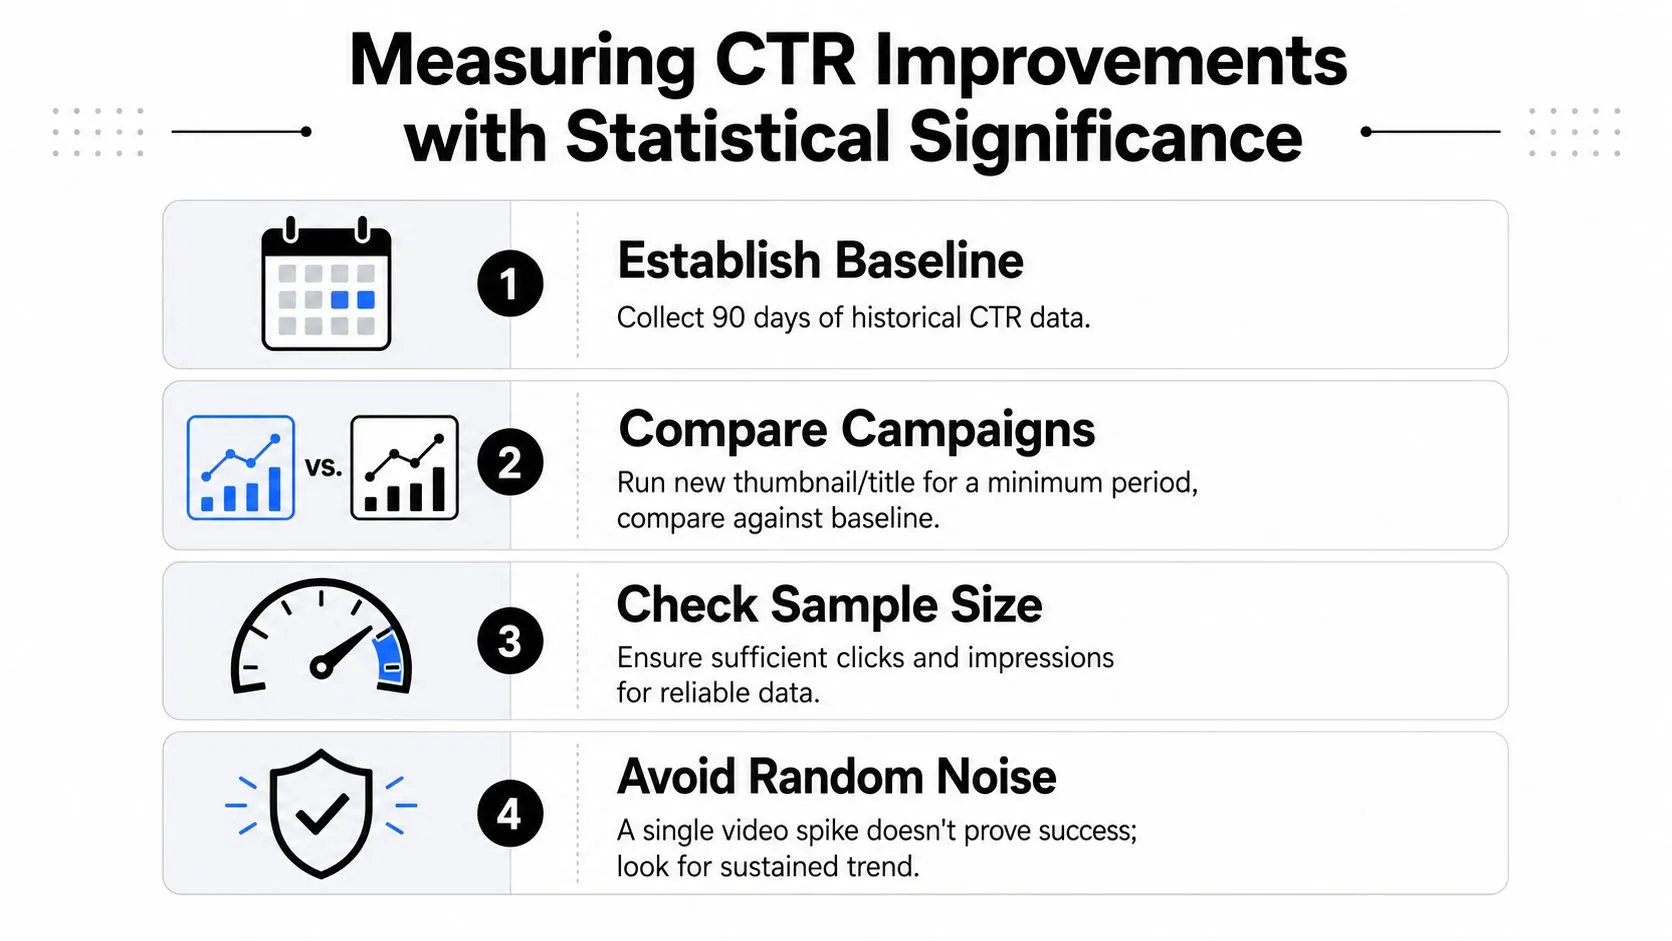
A single video’s CTR spike doesn’t prove that a thumbnail works. The audience mix may have changed, the video may have entered a different surface, or the early viewers may have been unusually familiar with the channel.
Start with a 90-day median for each traffic source. The case for benchmarking by source rather than by channel average is made clearly in Teleprompter’s YouTube CTR analysis, which notes that an overall channel CTR is really an average of several very different numbers and advises comparing videos across weeks or months rather than day to day. A median reduces the influence of unusually high or low uploads and gives you a practical reference point for Browse, Search, and Suggested.
Use a repeatable test record
Track each change in a spreadsheet with these fields:
- Video and surface: Identify the upload and the traffic source being evaluated.
- Baseline: Record the relevant 90-day median before the change.
- Variant: Describe exactly what changed in the thumbnail or title.
- Exposure: Log impressions and clicks, not just the displayed percentage.
- Context: Note changes in topic, audience mix, and distribution.
- Decision: Keep the variant only when the improvement remains consistent and viewing quality holds.
Statistical significance means the observed difference is unlikely to be ordinary random variation. You don’t need complicated language to apply the principle. Look for enough exposure to make the comparison credible, compare like with like, and seek a sustained pattern across relevant videos rather than celebrating one outlier.
Confidence intervals are useful because they express uncertainty around an estimate. A CTR reading with limited impressions can move sharply from a small number of additional clicks, while a result supported by a larger, comparable impression set gives you more confidence.
Treat testing as a learning system. Your goal isn’t to chase the highest visible percentage. Your goal is to identify which title and thumbnail decisions consistently improve qualified clicks on the traffic source where the current package underperforms.
Use Thumbo AI to generate thumbnail concepts from your video idea or source photos, then compare those concepts against your Browse, Search, and Suggested baselines. Visit Thumbo AI to create stronger packaging options and turn CTR improvement into a repeatable testing workflow.